On-chain data shows the Bitcoin RHODL Ratio has reversed upwards recently, a potential sign that a cycle transition could now be underway.
Bitcoin RHODL Ratio Could Be Hinting At Cooling Market Speculation
In a new post on X, the on-chain analytics firm Glassnode has discussed the latest shift in the RHODL Ratio of Bitcoin. The Realized HODL (RHODL) Ratio is an indicator that measures the ratio between the Realized Cap of two given HODL wave bands.
The Realized Cap refers to an on-chain capitalization model that calculates BTC’s total value by assuming that the value of each token in circulation is equal to the spot price at which it was last transacted on the blockchain.
In short, what this metric tracks is the amount of capital that the investors as a whole have put into the cryptocurrency. Here, the Realized Cap of only specific segments of the market is of interest: two “HODL wave bands” or cohorts corresponding to the supply aged between 1 day and 3 months, and that between 6 months and 2 years.
Naturally, the former HODL wave band represents the coins that the investors have just purchased. Thus, its Realized Cap would signify the capital that has recently entered into the network. Similarly, the Realized Cap of the latter group would correspond to the capital stored in the hands of resolute individuals.
Given this, the RHODL Ratio for these HODL wave bands would tell us about how the capital stored in the two parts of the sector currently compares. Below is the chart shared by the analytics firm that shows the trend in this Bitcoin metric over the history of the digital asset.
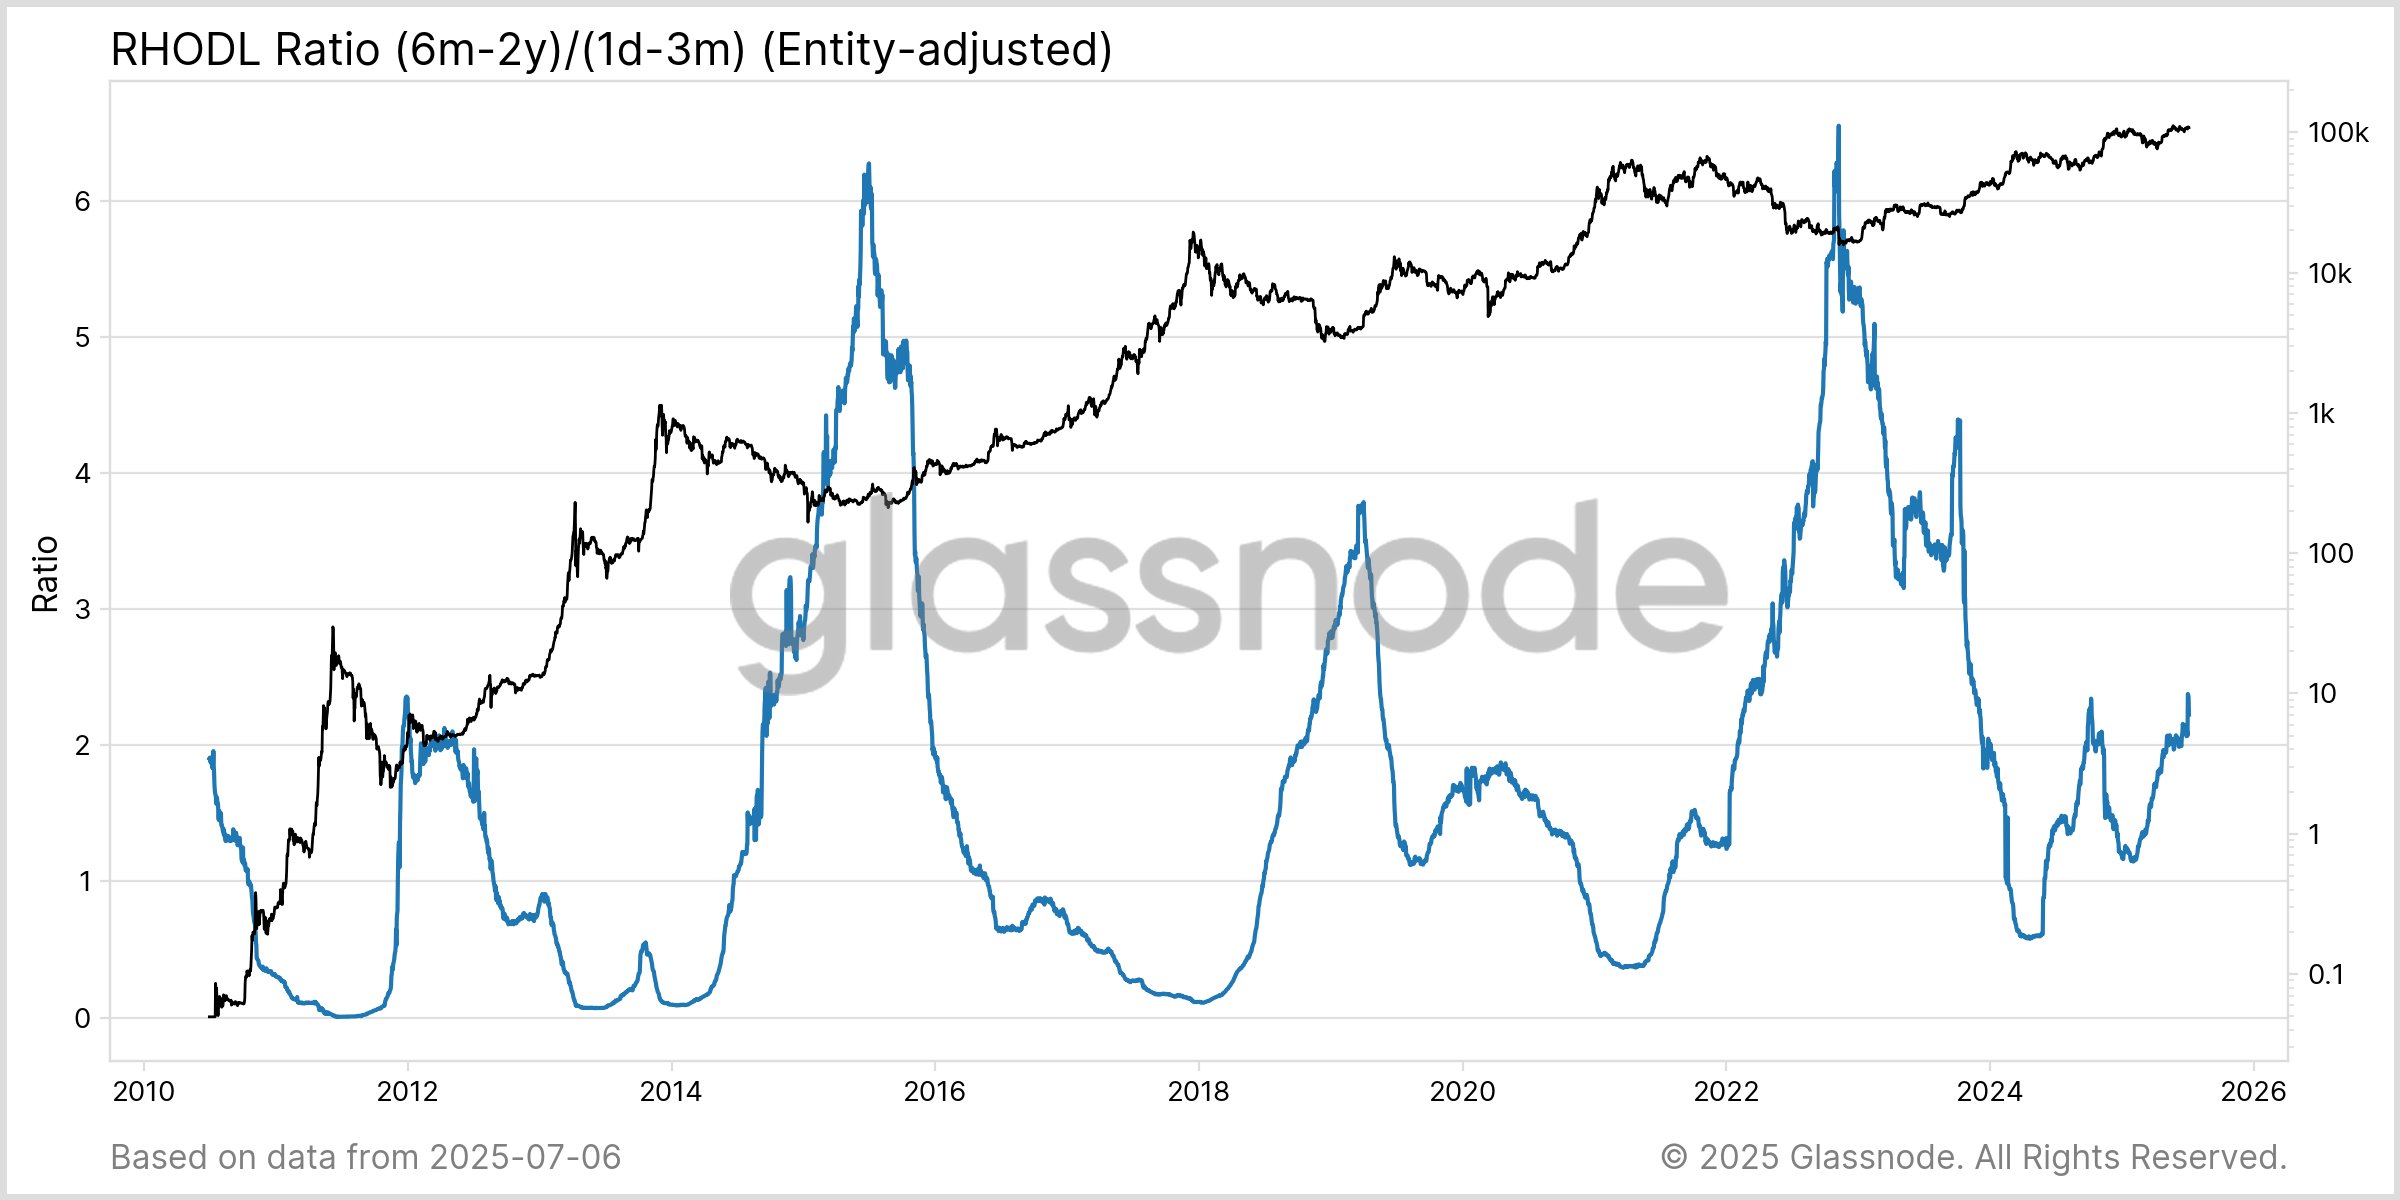
As displayed in the above graph, the Bitcoin RHODL Ratio has been following an upwards trajectory recently, meaning that capital has been maturing from new hands to the veterans holding for more than six months.
Following the latest continuation of the trend, the metric has reached the highest level for the current cycle. “This signals a shift: more wealth is held by single cycle holders, while 1d–3m activity stays low,” notes Glassnode.
From the chart, it’s visible that this pattern was generally witnessed alongside transitions during past cycles. And not just any transitions, but those happening away from bull markets.
So far, the RHODL Ratio is still far below the peaks seen during the last few Bitcoin cycles, so it only remains to be seen whether the current rise in the indicator is truly the start of a long-term shift like those past ones, or if it’s a temporary deviation.
BTC Price
At the time of writing, Bitcoin is trading around $109,300, up more than 1.5% in the last week.

You can get bonuses upto $100 FREE BONUS when you:
💰 Install these recommended apps:
💲 SocialGood - 100% Crypto Back on Everyday Shopping
💲 xPortal - The DeFi For The Next Billion
💲 CryptoTab Browser - Lightweight, fast, and ready to mine!
💰 Register on these recommended exchanges:
🟡 Binance🟡 Bitfinex🟡 Bitmart🟡 Bittrex🟡 Bitget
🟡 CoinEx🟡 Crypto.com🟡 Gate.io🟡 Huobi🟡 Kucoin.


Comments