Bitcoin is holding steady above the $108,000 level, maintaining a bullish structure despite repeated failures to break through its all-time high near $112,000. The price is consolidating in a tight short-term range, and whichever side breaks first will likely set the tone for the coming weeks. This period of low volatility may be the calm before the storm, as buyers and sellers prepare for the next major move.
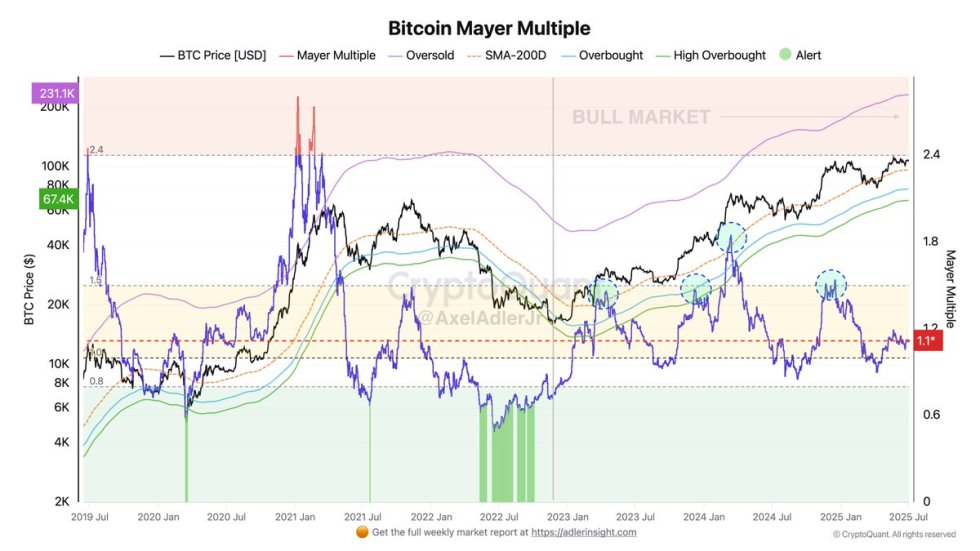
According to data from CryptoQuant, the Mayer Multiple — a classic indicator that measures Bitcoin’s price relative to its 200-day moving average — currently stands at 1.1x. This puts BTC in the “neutral” zone (0.8–1.5x), far below the overbought conditions typically seen in the late stages of bull markets. Historically, readings below 1.5x suggest that Bitcoin still has significant upside potential before hitting speculative extremes.
As the market awaits a breakout, investors are closely watching this metric for confirmation that BTC is still undervalued compared to past bull cycles. If Bitcoin can hold its current levels and push decisively above resistance, the neutral Mayer Multiple reading could serve as a launchpad for a renewed bullish trend — but failure to break out may invite a wave of short-term selling.
Bitcoin Holds Firm Amid Mixed Signals
Bitcoin price action has left many bulls frustrated, as the market continues to grind below its all-time high without a clear breakout. After weeks of consolidation near the $110K mark, traders are bracing for a decisive move. While the structure remains intact and support has held above $105K, the failure to push above previous highs could increase the probability of a sharp correction, potentially dragging BTC below critical demand levels that have served as a floor for the past month.
On the macro front, uncertainty appears to be easing. Conflicts in the Middle East are winding down, and US stock markets continue to set new all-time highs, signaling renewed risk appetite. However, not all signals are bullish. Rising inflation and elevated US Treasury yields have reintroduced systemic risk concerns, keeping investors on alert.
Top analyst Axel Adler offered a more optimistic perspective, pointing to the Mayer Multiple — a time-tested model that compares BTC price to its 200-day moving average. Currently sitting at 1.1x, the indicator remains firmly within the neutral zone (0.8–1.5x) and well below levels historically associated with market tops. Adler notes that this suggests Bitcoin is still trading at a discount to previous bull markets, and could have significant room to rally if momentum returns.
With mixed macroeconomic data and a neutral valuation model, Bitcoin’s next move will depend on whether bulls can reclaim control. A clean breakout above all-time highs would likely ignite a new phase of price discovery. But until then, caution prevails — the longer BTC stalls, the more likely sellers will test support.
BTC Consolidates Below All-Time High
Bitcoin continues to consolidate just below its all-time high, trading at $108,474 at the time of writing. The 3-day chart shows price action tightly compressed between key levels, with strong support at $103,600 and resistance at $109,300 — the latter being tested repeatedly over the last two weeks. This range-bound structure reflects indecision as bulls attempt to break higher, while bears fail to reclaim control.
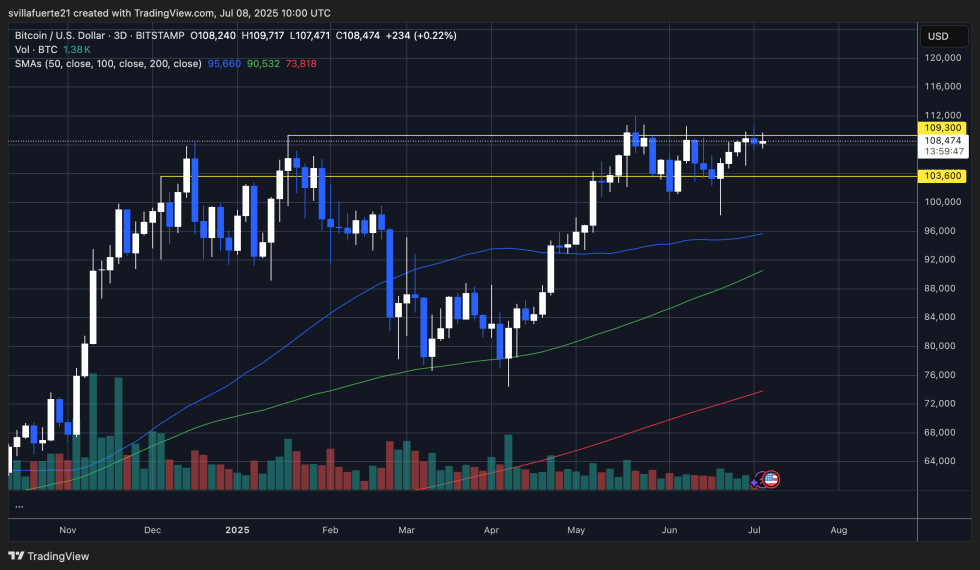
Notably, BTC remains firmly above the 50-day (blue), 100-day (green), and 200-day (red) moving averages, indicating underlying strength in the trend. Volume remains moderate, but it has picked up during upward moves, suggesting continued buy-side interest near support.
The longer BTC holds above $105K and maintains this higher low structure, the greater the probability of a breakout toward uncharted territory above $112K. However, rejection at the $109K level could lead to another retest of support zones. Momentum indicators, while not shown, are likely flattening, consistent with the sideways action.
Given the narrowing range and rising tension between support and resistance, a decisive move is imminent. Traders should watch for a clean breakout above $109,300 or breakdown below $103,600 — either will likely define Bitcoin’s direction heading into Q3.
Featured image from Dall-E, chart from TradingView

You can get bonuses upto $100 FREE BONUS when you:
💰 Install these recommended apps:
💲 SocialGood - 100% Crypto Back on Everyday Shopping
💲 xPortal - The DeFi For The Next Billion
💲 CryptoTab Browser - Lightweight, fast, and ready to mine!
💰 Register on these recommended exchanges:
🟡 Binance🟡 Bitfinex🟡 Bitmart🟡 Bittrex🟡 Bitget
🟡 CoinEx🟡 Crypto.com🟡 Gate.io🟡 Huobi🟡 Kucoin.


Comments